How to Use
 Viewer
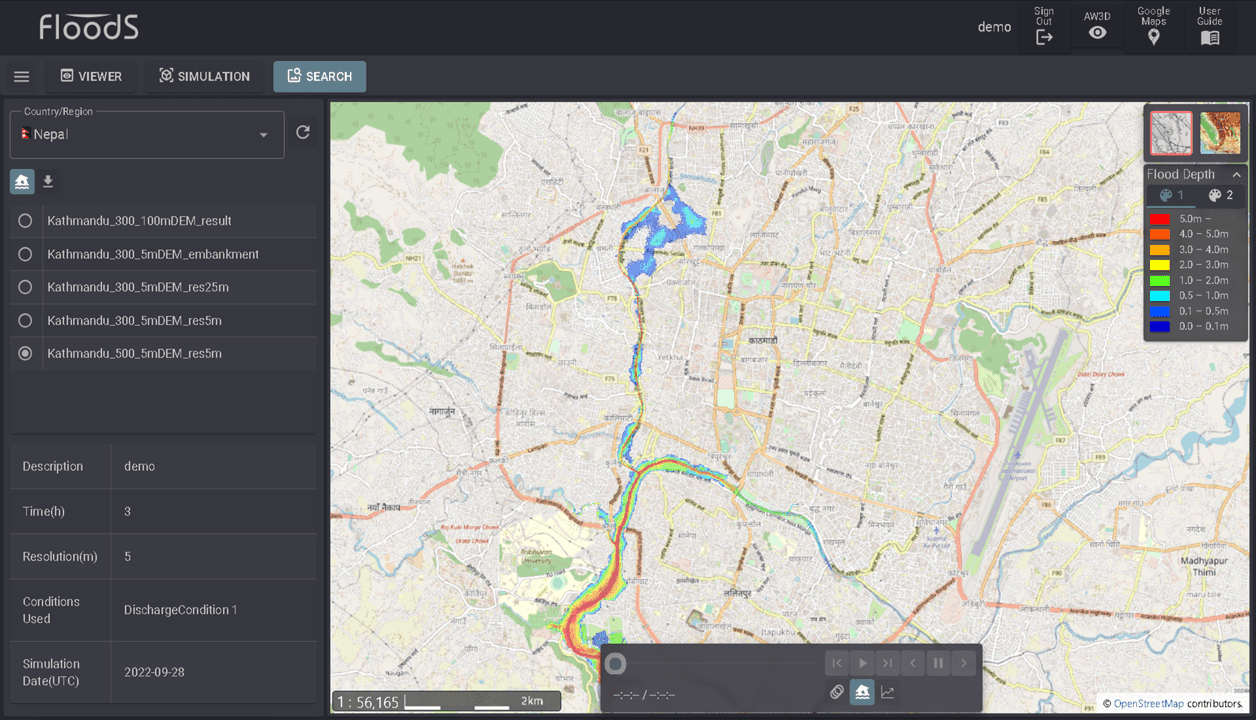
Anyone can check the registered simulation results.You can select the results you want to see on the map and check the flooded area in animation.
-
Selecting simulation results
Select the
 icon on the map.
 -
The selected simulation results can be confirmed on the map using colors according to the depth of the flood.
-
How to operate the animation tools displayed at the bottom of the map.
 : Play.
 : Pause.
 : Advance by 5 minutes.
 : Move back 5 minutes.
 : Return to the beginning.
 : Advance to the end.
 : Grab the slider and select the desired time.
-
-
Check the maximum inundation area and inundation depth of the simulation results
Select
 button to see the map showing the maximum inundation area and inundation depth.
 -
Check the specified point of the simulation result
When
 button is selected, clicking on a point on the map to be checked will display a graph showing the change in inundation depth at the desired point. Move the cursor over the graph to see the numerical values.
 Simulation
In the Simulation function, only registered users can perform simulations. Simulation is performed in three steps: setting project information, setting conditions, and starting the simulation.
-
Setting project information
Select
 button in the "Project" area on the left to display the "Projects list.
To create a new simulation, select
 button under "New Project.
To use a project that has already been created, select
button under the specified project name. : Copy and create a new project.
 : Delete the project.
import project file
If you want to use another user's project, select
 button in the "Project" area to import the project file.
 -
Setting simulation conditions
Set the conditions in the "Conditions" area. The following three operations are used to set the conditions.
-
Select
 button.
 -
Specify the location and range of the condition on the map.
-
Enter the attribute information of the condition.
-
-
Start simulation
Select
 button in the "Simulation" area on the left to start setting simulation conditions. There are five items to be entered for simulation conditions.
-
"Name" is the name of the simulation result.
-
"Time" is for setting the simulation time.
-
"Resolution" specifies the resolution condition.
The items that can be selected by resolution are limited depending on the range of conditions.
-
If you have specified a range of 10km square or more, you cannot select "5m".
-
If you have specified an area of 50km square or more, you cannot select "5m" or "25m".
-
Calculations cannot be performed if you specify an area larger than 200km square.
-
-
"Condition of use" allows you to check the conditions to be used in the simulation. Uncheck the conditions that are not used.
-
Check the current simulation status in the "Calculation Status" area and click the "START" button to start the calculation. If there are more than 5 users in the calculation, the calculation will start after the previous user's calculation is completed.
-
Once the simulation starts, you can check the status of the calculation in the "Result" area.
 : Waiting for calculation process
 : Calculation in progress
 : Calculation completed
 : State of calculation suspended
 : State of calculation error
To stop the simulation, click
 button.
When the simulation is finished, you can check the maximum flood depth on the map by selecting the
button.Select
 button to download the conditions of the calculation and the maximum inundation depth. The "KML" format file can be viewed with Google earth software.
The results of the simulation can be displayed in a graph by selecting
button and clicking on the point on the map where you want to check the results. The results of the simulation can be viewed by selecting the button and clicking on a location on the map to view the graph.To check the calculation conditions and share the results, select
 button, check the calculation details, and change the "Status" item to "shared" if you want to share the results.
To delete the simulation results, select
 button.
 -
 User account
To use "SIMULATION" to run simulations and "SEARCH" for shared functions, you need to log in. If you wish to use these functions, please contact the operation administrator, and a user account will be issued after a screening process. After issuance, user authentication is performed in the following two steps.

-
Enter the ID and password notified by the operation administrator to log in.
Forgot your password
If you have forgotten your password, please select "Forgot your password?" and set a new password.
-
If you have not used the system for the first time or for 30 days since your last use, a one-time password will be sent to your registered e-mail address. Please enter the one-time password.
 Flood Depth
'Flood Depth' condition sets information about the flood depth at a specific point. Surrounding flooding conditions can be simulated based on flooding depth information. The information to be set includes the depth of flooding and duration of flooding. Various flooding phenomena can be simulated depending on the location.
<Example>
-
River flooding simulation if set near a river.
-
Drainage shortage simulationIf if set in an urban area.
-
Storm surge simulation if set on the coast.
-
Dam breach simulation if set to dam.
-
Drainage simulation if set to drainage facility.
The following three operations are used to set the conditions.
-
Select the
button. -
Specify the location of the inundation depth information on the map.
-
Enter the inundation depth and duration on the attribute information screen.
The procedure for changing the created conditions is as follows.
-
If you want to modify the selected position, please select
 button.
 -
If you want to modify the attribute information, please select
 button.
 -
If you want to delete the created condition, select
button.
 Flood Flows
’Flood Flows’ condition sets information about the amount of water flowing from a specific point. You can simulate the surrounding flooding situation from that water. Information to be set includes flow rate and duration. Various flooding phenomena can be simulated depending on the location.
<Example>
-
River simulation when set to river.
-
River overflow simulation when set at the overflow point from the river.
-
River breach simulation if set at the point where an embankment breaks from a river.
-
Dam breach simulation if set to dam.
The following three operations are used to set the conditions.
-
Select the
button. -
Specify the extent of flood flow on the map.
-
Enter the flood flows and duration on the attribute information screen.
display waterway information
Select the
button to display waterway information.You can check the flow rate and river width at the point where you placed the cursor. Check the flow rate information as a guideline for the river flow scale, and set the condition to a flow rate of about 10% to 20% of the flow rate information.
import CSV file
If you select
 button, you can import time change information from a CSV file.
The CSV format that can be entered specifies time and flow rate data separated by commas. Please refer to the sample file below.
Download Sample file
The procedure for changing the created conditions is as follows.
-
If you want to modify the selected position, please select
button. -
If you want to modify the attribute information, please select
button. -
If you want to delete the created condition, select
button.
 Rainfall
‘Rainfall’ condition sets conditions for the same amount of rainfall in the specified range. It is possible to simulate the type of flooding that occurs when rainfall falls within the specified area and water accumulates in low-lying areas and cannot be drained. The information to be set is rainfall amount and duration. You can simulate flooding caused by short-term heavy rains that occur in cities on the plains.
The following four operations are used to set the conditions.
-
selecting
 button, you can check information on the maximum hourly rainfall calculated using the climate change model.
climate change model
This rainfall data used data produced with the Earth Simulator by the Program for Risk Information on Climate Change (SOUSEI) from the Ministry of Education, Culture, Sports, Science and Technology (MEXT), Japan. Maximum value extracted from the data of the RCP8.5 scenario in the 20 km grid global atmospheric model climate projection dataset.
-
Select the
button. -
Specify the rainfall area on the map.
-
Enter the rainfall and duration on the attribute information screen.
Enter the hourly rainfall value checked in 1 as a reference.
The procedure for changing the created conditions is as follows.
-
If you want to modify the selected position, please select
button. -
If you want to modify the attribute information, please select
button. -
If you want to delete the created condition, select
button.
 Surge
Surge
'Surge' condition automatically or manually creates a shoreline and sets the water level condition on that shoreline. By setting the wave height, it is possible to simulate flooding in low-lying areas on the land side. The information to be set is tide level and time. Automatic shoreline extraction uses topographic data to extract the boundary line between sea and land. When creating a shoreline manually, you can check the map and set the location.
The following three operations are used to set the conditions.
-
Select the
button.-
If you want to automatically extract the shoreline, select "Automatic detection area".
-
If you want to set the shoreline manually, select "Shoreline".
-
-
Specify the range to extract the shoreline on the map or the position of the shoreline.
-
Enter the tide level and duration on the attribute information screen.
import CSV file
If you select
button, you can import time change information from a CSV file.The CSV format that can be entered specifies time and tide level data separated by commas. Please refer to the sample file below.
Download Sample file
The procedure for changing the created conditions is as follows.
-
If you want to modify the selected position, please select
button. -
If you want to modify the attribute information, please select
button. -
If you want to delete the created condition, select
button.
 Embankment
'Embankment' condition can be set as a condition that complements the terrain. The information to be set is the height condition for the specified section. The simulation results will change depending on the meaning of the specified height.
- Correcting to the current height will improve the accuracy of the flooding simulation.
- By correcting to the future height, it becomes the simulation result of the countermeasure.
The following three operations are used to set the conditions.
-
Select the
 button.
 -
Specify the location on the map with a line.
-
Enter the height on the attribute information screen.
For the height of the embankment, enter the "Terrain+Height" or "Height" value directly in the table.
-
If you want all "Terrain+Height" to be the same value, enter the specified height in "Terrain+Height" below and select the "APPLY" button.
-
If you want all the embankments to have the same height, enter the specified height in "Embankment height" and select the "APPLY" button.
-
The procedure for changing the created conditions is as follows.
-
If you want to modify the selected position, please select
button. -
If you want to modify the attribute information, please select
button. -
If you want to delete the created condition, select
button.
 Tunnel
'Tunnel' condition can be set as a condition that complements the terrain. The information to be set is the width and height conditions of the specified section. The simulation results will change depending on the meaning of the specified information.
- Correcting to the current information will improve the accuracy of the flooding simulation.
- By correcting to the future information, it becomes the simulation result of the countermeasure.
The following three operations are used to set the conditions.
-
Select the
button. -
Specify the location on the map with a line.
-
Enter the width and height on the attribute information screen.
For the width information, the width must be smaller than the resolution condition as a constraint of the simulation.
The procedure for changing the created conditions is as follows.
-
If you want to modify the selected position, please select
button. -
If you want to modify the attribute information, please select
button. -
If you want to delete the created condition, select
button.
 Search
The Search function allows you to view simulation results that are shared only with registered users. Simulation results can be downloaded in KML format. Calculation conditions can be downloaded and imported using the project import function.
-
Selecting simulation results
Selecting "Country/Region" will display a list of shared results. Select the radio button for the result you wish to review.
display latest shared results
Select
 button to display the latest shared results.
 -
Check the simulation results
You can check the animation of the inundation area, the maximum inundation area and the inundation depth. The initial display is an animation. To check the maximum inundation depth, select
button. -
Downloading simulation results
To download the calculation conditions, select
button and choose "Project file".To download the maximum water depth results, select
button, then select "Max water depth".